Friday, March 22, 2019
Thursday, February 28, 2019
Success formula in our life
- Insatiable appetite for knowledge
- Know the basics
- Identify the gaps in your knowledge
- Constantly update
- Expose the linkages
- Expose diverse views
- Write, argue and debate
Reference: https://www.youtube.com/watch?v=_svETMOY9zY
Monday, February 4, 2019
Hyper parameters with GridSearch
Building a better model involves iteration and tuning these hyperparameters.
Grid search uses cross validation, splitting the training data up into folds for training and testing of each hyperparameter combination. After all hyperparameter variants are trained, the original test data is used to validate the final model.
GridSearchCV
takes a dictionary that describes the parameters that should be tried and a
model to train. The grid of parameters is defined as a dictionary, where the
keys are the parameters and the values are the settings to be tested.
from sklearn.model_selection import GridSearchCV from sklearn.metrics import classification_report from keras.wrappers.scikit_learn import KerasClassifier from keras.models import Sequential import time
def dense_model(units, dropout):
model = Sequential()
model.add(Dense(units, activation='relu', input_shape=(28, 28,)))
model.add(Dropout(dropout))
model.add(Dense(units, activation='relu'))
model.add(Dropout(dropout))
model.add(Flatten())
model.add(Dense(10, activation='softmax'))
model.compile(loss='categorical_crossentropy',
optimizer='adam',
metrics=['accuracy'])
return model
hyperparameters = {
'epochs': [1],
'batch_size': [64],
'units': [32, 64, 128],
'dropout': [0.1, 0.2, 0.4]
}
model = KerasClassifier(build_fn=dense_model, verbose=0)
start = time.clock()
grid = GridSearchCV(estimator=model, param_grid=hyperparameters, cv=6, verbose=4)
grid_result = grid.fit(x_train, y_train)
print("Best: %f using %s" % (grid_result.best_score_, grid_result.best_params_))
y_true, y_pred = np.argmax(y_test, axis=1), grid.predict(x_test)
print()
print(classification_report(y_true, y_pred))
print()
print(time.clock() - start)
Saturday, February 2, 2019
How to get current available GPUs in tensorflow?
Working with a GPU can be 20-50x faster!
Reference Link:
https://stackoverflow.com/questions/38559755/how-to-get-current-available-gpus-in-tensorflow
Reference Link:
https://stackoverflow.com/questions/38559755/how-to-get-current-available-gpus-in-tensorflow
Wednesday, January 16, 2019
Monday, December 17, 2018
The AI Index 2018 report is out!
My most interesting areas are DL and NLP
http://cdn.aiindex.org/2018/AI%20Index%202018%20Annual%20Report.pdf
Sunday, December 2, 2018
Anomaly detection system POC
Got an opportunity to work on time series data and Anomaly detection application on Data center.
This system is capable
of monitoring health of servers and provides remediation whenever server is
unhealthy. Our Intelligent system uses Machine Learning to detect or forecast
Anomalies and warn the Service providers to ensure timely action
· We have designed the
Orchestrator in such a way that it monitors those specific services which are
added to our database. When any service goes down it raises a ticket, then it
will run corresponding remediation solution to resolve the issue. Finally it
closes the ticket after it completes the resolution.
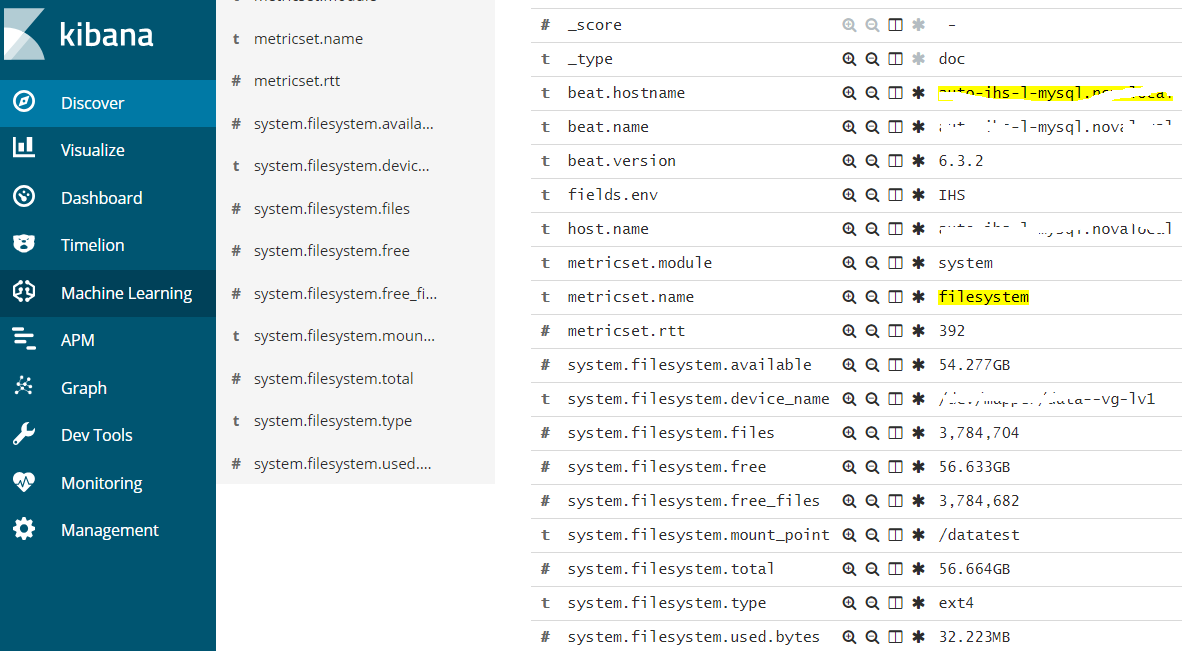
· ELK Stack is used to
collect the data/stats from specific server for monitoring health, in turn we
use machine learning models to predict the anomaly in the data captured for the
specific duration.
· In the similar way our
machine learning model also forecasts the future potential anomalies based on
specified criteria and raise a warning ticket for timely action hence it is
capable of preventing upcoming issues
Used Plotly for visualizing the plots.
Subscribe to:
Posts (Atom)